Demographics
Portland, like other metropolitan areas is a place of diversity between people, backgrounds, education and culture. This section attempts to show the spatial make up of different ethnicities in the Portland metro area.

Overall Population Density
This map shows the overall population density in the Portland metropolitan area. It uses the 2010 census tract data. The darker areas are census tracts that have a higher population density. The most dense areas are in downtown Portland and the immediate suburbs and residential areas surrounding them. A rough outline of the growth boundary is shown by this map.
Other pockets of population density are Vancouver, on the north side of the river, Gresham to the east, and the Intel corporate cluster in Hillsboro to the west in Washington county.
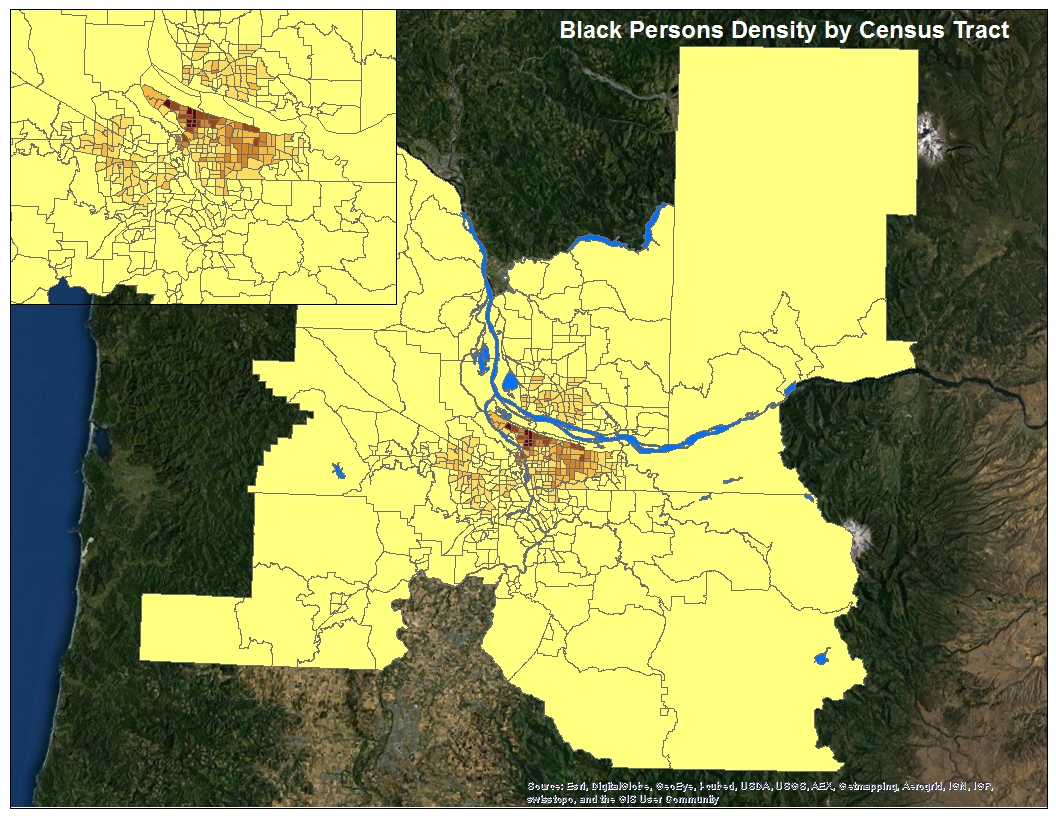
Black Population Density
This map shows the population density of black persons in the Portland metropolitan area. It uses the 2010 census tract data. The darker areas are census tracts that have a higher population density. The darkest portions are on the northern side of Multanomah county. On the north side of the city of Portland. This area backs up to mostly a industrial area with the international airport between it and the Columbia river.
This map shows the population density of black persons in the Portland metropolitan area. It uses the 2010 census tract data. The darker areas are census tracts that have a higher population density. The darkest portions are on the northern side of Multanomah county. On the north side of the city of Portland. This area backs up to mostly a industrial area with the international airport between it and the Columbia river.
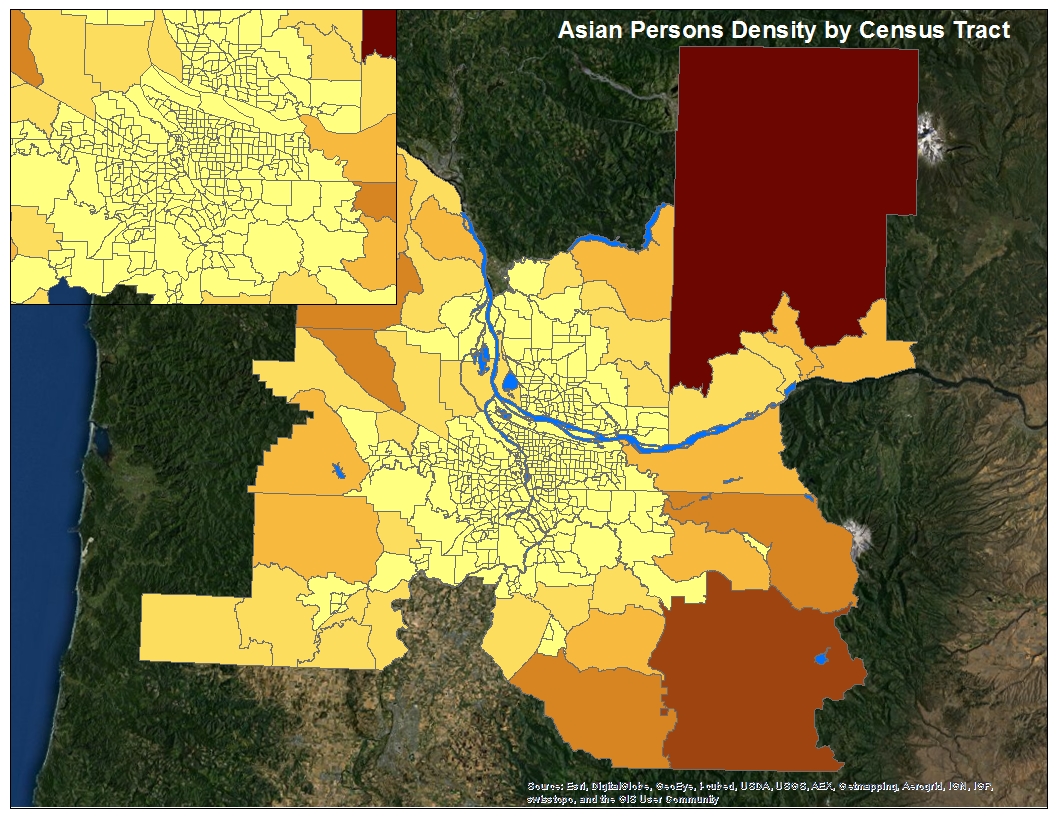
Asian Population Density
This map shows the population density of Asian persons in the Portland metropolitan area. It uses the 2010 census tract data. The darker areas are census tracts that have a higher population density. When this map was first produced I thought that the data was wrong. How could the population be a negative image of the normal characteristic of being nearer to the urban center. It is still anomaly.
This map shows the population density of Asian persons in the Portland metropolitan area. It uses the 2010 census tract data. The darker areas are census tracts that have a higher population density. When this map was first produced I thought that the data was wrong. How could the population be a negative image of the normal characteristic of being nearer to the urban center. It is still anomaly.
White Population Density
This map shows the population density of White persons in the Portland metropolitan area. It uses the 2010 census tract data. The darker areas are census tracts that have a higher population density. The white population is focused primarily in the urban core and its adjacent suburbs in Skamania, Clackamas and Washington counties.
This map shows the population density of White persons in the Portland metropolitan area. It uses the 2010 census tract data. The darker areas are census tracts that have a higher population density. The white population is focused primarily in the urban core and its adjacent suburbs in Skamania, Clackamas and Washington counties.
